| 4:00-4:30 | Pre-conference tour of UConn Libraries – MAGIC |
| 4:30-4:45 | Registration – Thomas J. Dodd Research Center |
| 4:45-5:00 | Welcome – Bill DeGrazia & Tom Brodnitzki, CGA Co-Coordinators |
| 5:00-6:00 | Keynote Speaker – Arthur Bakis – U.S. Census Bureau Boston Regional Office |
| 6:05-6:55 | Buffet Dinner and Remarks |
| 7:00-7:50 | Breakout Sessions I – Elementary Teachers – Allyson Lubs, Professional Development CGA II – Middle & High School Teachers – Kristie Blanchard, NE Geography Teacher of the Year III – Exploration of American Community Survey (ACS) – Michael Howser, Connecticut State Data Center |
| 7:50-8:00 | CEU Records and Drawings |
Author Archives: Michael Howser
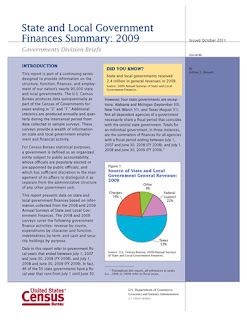
Census Bureau Reports State and Local Governments Revenue (Nationally) Declines 22 Percent in 2009
In 2009, state and local governments brought in nearly $2.1 trillion, a 22.1 percent ($587.5 billion) decrease from 2008, according to statistics from the U.S. Census Bureau. Most tax revenue categories saw declines except property tax, which saw a 3.7 percent increase to $424.0 billion.
- Unemployment compensation saw an 86.0 percent increase from $35.6 billion in 2008 to $66.2 billion in 2009.
- Insurance benefits and repayments increased 17.9 percent to $275.5 billion.
- Spending on administering social insurance increased 12.6 percent from $4.1 billion in 2008 to $4.6 billion in 2009.
- Revenue from individual income taxes decreased 11.3 percent from $304.9 billion to $270.5 billion.
- Corporate income taxes revenue declined 19.2 percent to $46.0 billion.
- Insurance trust revenue dropped 683.5 percent to $-498.0 billion, driven by employee retirement losses. Insurance trust revenue includes retirement and insurance contributions and earnings and losses on investment assets.
- Cash and security holdings decreased 15.0 percent to $4.6 trillion because of a decrease in employee retirement assets, which declined 23.8 percent in 2009.
- Spending on highways comprised more than 10.0 percent of expenditures in Alaska, North Dakota and South Dakota. (See Table 3 [Excel])
Source: U.S. Census Bureau
A Survey of NYC’s Privately Owned Public Spaces
 |
| As of the morning November 3, 93 of the 391 privately owned public spaces had been visited. |
WNYC’s Brian Leher Show and The New York World have initiated a mapping project to survey privately owned public spaces (like Zuccotti Park – home to Occupy Wall Street demonstrations) in New York City. The collaborators are asking the public to fill out a form that describes their experiences at the places. The questions include:
- What day of the week did you visit the space?
- What time did you visit the space?
- Users are asked to rank the condition of the space (1-5)
- What kinds of features define this space?
- What kinds of activities are happening in this space?
The deadline for submissions is November 9th. The results of this project, which I look forward to seeing, should create an interesting narrative that describes what these spaces are like and how they are used, which is especially compelling in light of recent events.
Census Bureau to Release Supplemental Poverty Measure Research – November 7
On Monday, Nov. 7, the U.S. Census Bureau will release research on a supplemental poverty measure that complements, but does not replace, the nation’s official poverty measure.
Census Bureau subject matter experts will host a technical webinar Friday, Nov. 4 in advance of the release to provide background into the development of the supplemental measure as well as the methodology used.
The Census Bureau developed the supplemental poverty measure after years of research and collaboration with the National Academy of Sciences and other organizations. The supplemental measure is designed to reflect contemporary social and economic realities and further our understanding of economic conditions and trends.
Please login early, as some setup is required.
URL: <https://www.mymeetings.com/nc/join/>
Conference/meeting number: PW9176213
CT ECO Maintenance for November 1-3, 2011 Postponed
The previously scheduled maintenance of CT ECO from Nov 1-3 has been postponed to ensure CT ECO maps, viewers and map services are available during the storm recovery. All sections of CT ECO are available for use.
CT ECO is available at: http://cteco.uconn.edu
Connecticut Power Outages
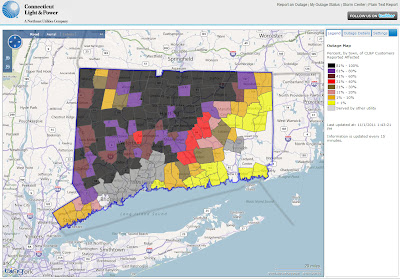
If, like me, you are still without power in Connecticut, you may find these following resources from Connecticut Light and Power useful:
Map of Affected Customers by Town – This map displays the percentage of CL&P customers affected by outages.
 |
| A screenshot of the CL&P outage map as of Tuesday, 2 PM. |
List of Estimated Restoration Projects by Town – This list displays the estimated time that restoration projects will be completed. Some estimates indicate that electricity will not be restored until this weekend, while other towns are shown at all.
 |
| A screenshot of restoration estimates as of Tuesday, 2 PM. |
Global Human Population Reaches 7 Billion
Yesterday, it is estimated that the global human population reached 7 billion people. In response, ESRI has highlighted a map they have created that shows the world population by country. In addition to the symbology showing geographic distribution, users can also click on individual countries to access a pop-up window that shows the precise population and population graphs. If you want to know where you fit in in this world of 7 billion, check out What’s Your Number? from Population Action International.
Are Toxic Chemicals Being Released Near You?
 |
| Screenshots from the EPA myRight-to-Know app that show facilities registered with the Toxic Release Inventory: the left image shows the Storrs-Willimantic, CT area while the image on the right displays the Hartford, CT area. |
CT ECO Maintenance November 1-3, 2011
CT ECO will be unavailable Nov 1-3 due to scheduled maintenance. At this time, certain sections of the website including the Map Catalog, Simple Map Viewer, Advanced Map Viewer and Map Services for GIS users may be not be available for use. We apologize for any inconvenience this may cause.
CT ECO can be accessed at: http://cteco.uconn.edu
Poverty Among Latino Children At An All-Time High
 |
| According to a Pew Hispanic Center report, poverty among children in the U.S. is now highest in the Latino population. |
According to a recent report from the Pew Hispanic Center, poverty among Latino children is at an all time high and, for the first time, has displaced White children as the single largest group of children in poverty:
“More Latino children are living in poverty—6.1 million in 2010—than children of any other racial or ethnic group. This marks the first time in U.S. history that the single largest group of poor children is not white. In 2010, 37.3% of poor children were Latino, 30.5% were white and 26.6% were black.”
Also according to the report, while about two-thirds of the children’s parents immigrated to the United States, an overwhelming majority (86%) of the children were born in America. It seems that this increase, both relative and absolute, is another impact of the Great Recession:
“Prior to the Great Recession, more white children lived in poverty than Hispanic children. However, since 2007, that pattern has reversed. Between 2007 and 2010, an additional 1.6 million Hispanic children lived in poverty, an increase of 36.3%. By contrast, even though the number of white and black children living in poverty also grew, their numbers grew more slowly—up 17.6% and 11.7% respectively.”


