New ACS data on county-level income inequality

According to the latest American Community Survey (ACS) data released today by the Census Bureau, more than half of Americans live in counties that experienced a statistically significant increase in income inequality between the 2007-11 and 2012-16 ACS survey periods. The latest 2012-16 ACS 5-Year Estimates dataset indicates that inequality has increased significantly in almost a quarter of U.S. counties since the 2007-11 ACS 5-Year Estimates survey period. There was a statistically significant increase in inequality in 742 counties, a decrease in inequality in 86 counties, and no statistically significant change in the other 2,312 counties.

American Community Survey 5-Year Estimates datasets include demographic and economic statistics for all geographic entities, including counties with relatively small populations; as the ACS is a sample survey, estimates for these area tend to have higher corresponding margins of error. This visualization utilizes a calculation to take into account the sampling error associated with each estimate of county-level income inequality, to determine if differences in measured inequality between the two survey periods are statistically significant. Click any county in the map below to see a link to the original American Community Survey data for the county, through the American FactFinder data portal.

[xyz-ihs snippet=”GINI-change-counties-2007-2016-120717″]

Connecticut’s Towns Experiencing a Demographic Shift from 2015 to 2040, Connecticut State Data Center Reports

August 31, 2017 – Towns in Connecticut are projected to slowly gain population as a total, according to the 2015 to 2040 population projections for all 169 towns in the state of Connecticut, released today by the Connecticut State Data Center.

2015_2040_town_projected_growth

1970-2010 Population and 2015-2040 Projected Population for Top 10 Towns Projected to Experience Largest Percentage of Population Growth

The new projections show that multiple towns are approaching a demographic shift due to an aging population, a near net zero overall migration rate, and a relatively low, but stable, birth rate.  Windham, East Windsor, Avon, Oxford, Ellington, Sterling, Norwich, West Haven, Rocky Hill, and Manchester are expected to experience the largest percentage of increase in overall population projected from 2015 to 2040.

2015_2040_town_projected_decline

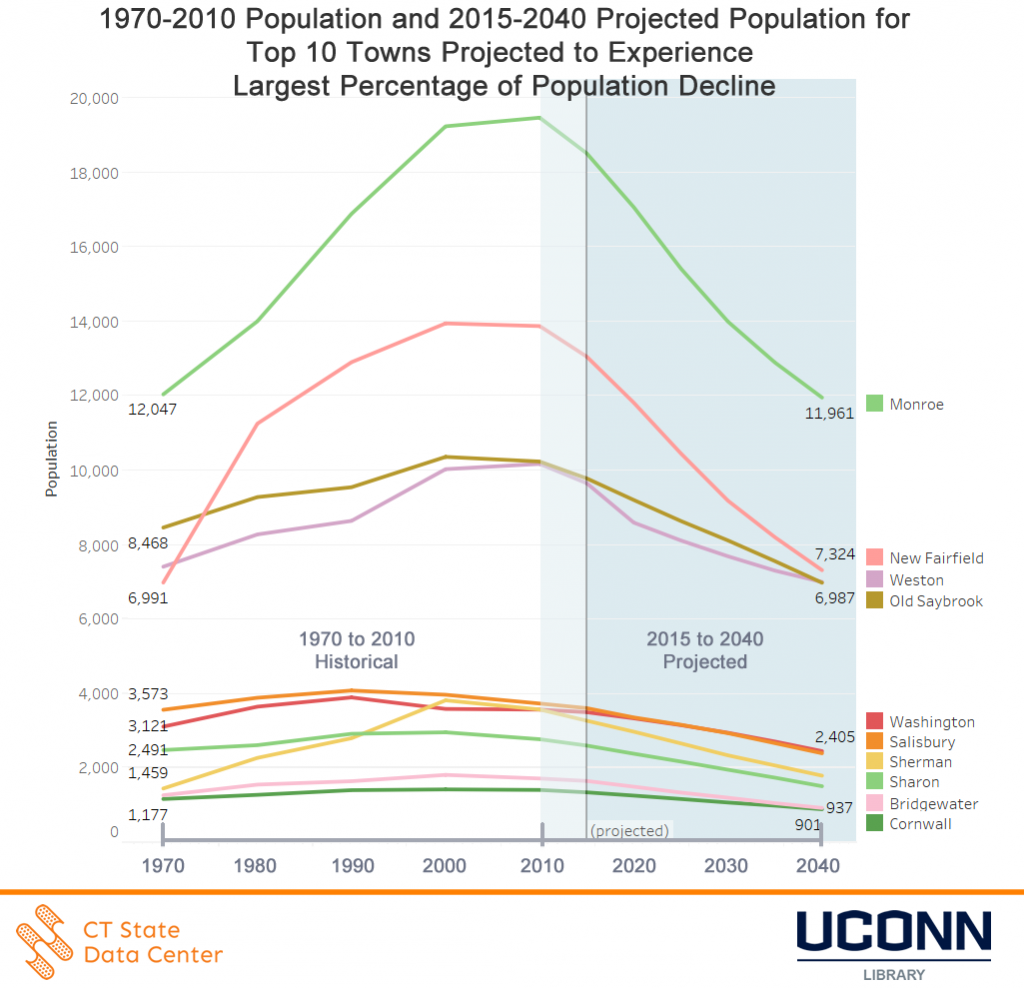
1970-2010 Population and 2015-2040 Projected Population for Top 10 Towns Projected to Experience Largest Percentage of Population Decline

The towns of Sherman, New Fairfield, Bridgewater, Sharon, Monroe, Cornwall, Salisbury, Old Saybrook, Washington, and Weston are projected to experience the largest percentage of decline in the overall population from 2015 to 2040.

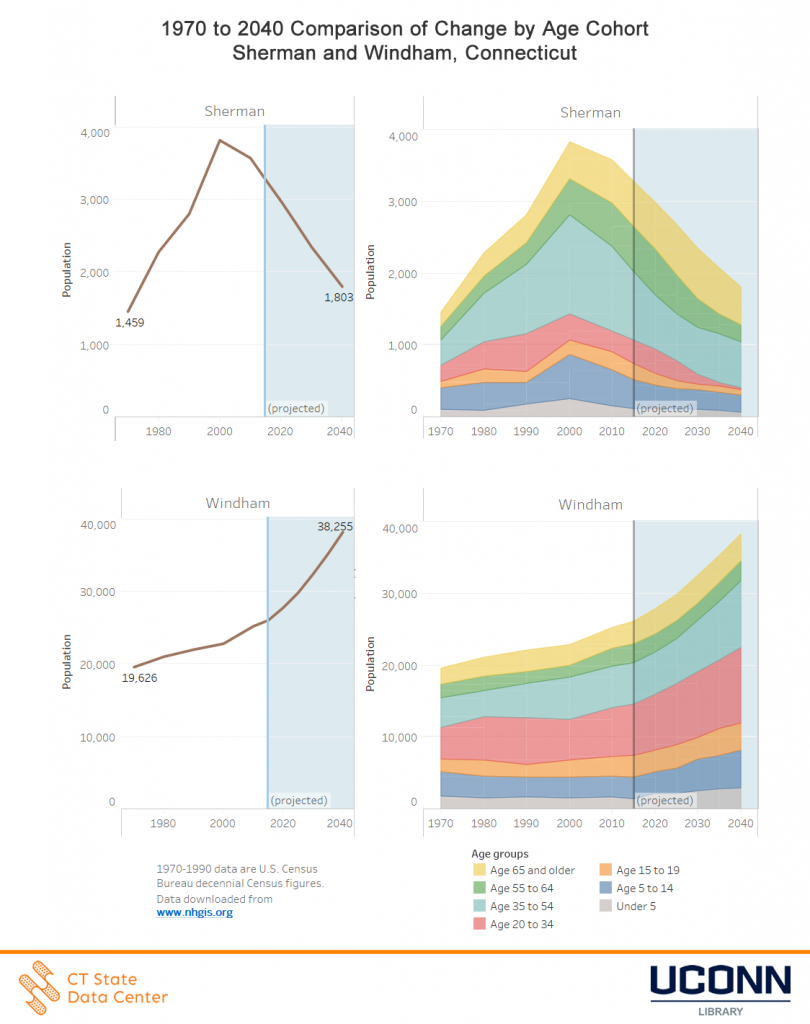
The changing demographics by age cohort for towns in Connecticut provides a more complete picture of the overall trends within towns over time.  The Connecticut State Data Center has released an interactive data dashboard to accompany the release which enables users to view demographic changes town by town with data from 1970 to 2040.  When reviewing the age cohort data, long-term trends in demographics shifts within towns, and more broadly across the state when comparing multiple towns, indicate which towns are experiencing stable or declining births by examining the under 5 age cohort, as well as visually presenting the demographic shift between age cohorts as individuals age 55 to 64 age into the 65+ age cohort.


The comparison between are largest percentage of population gain (Windham) versus our largest percentage of population decline (Sherman) highlights the shifts in age cohorts within these towns.

1970_2040_age_cohort_change_Sherman_Windham

1970 to 2040 Comparison of Change by Age Cohort for Sherman and Windham, Connecticut


Connecticut’s eight most populous towns will see a growing or stable population based on the projections from 2015 to 2040, following an overall trend for several of these towns since 2000.

Overview, Connecticut will grow slowly in population from 2015 to 2040. The projected populations for each town can differ over time based on factors not included within the projections model, and thus these population projections are reviewed annually by the Connecticut State Data Center and compared to the most recent data to adjust projections if data reflects changes in the projected trend for a town. For more details on the data release and how to view and access data, visit the Connecticut State Data Center 2015 to 2040 Town Population Projections site.

Connecticut State Data Center Embargo Release of 2015-2040 Population Projections for the State of Connecticut Towns

August 15, 2017 – The Connecticut State Data Center will release the 2017 edition of the state of Connecticut Town Population Projections for 2015 to 2040 on August, 31, 2017.  This release will include population projections by five year age cohorts and sex for each of the 169 towns in the State of Connecticut.  This release only includes town population projection with other geographies for Connecticut to be released in upcoming releases.  Prior to the public release of the town population projections for 2015 to 2040, the Connecticut State Data Center will offer embargo access to the media and to Connecticut focused data organizations in advance of the public release.

When: Tuesday, August 29, 2017 at 10 a.m. EDT to Thursday August 31, 2017 at 12:01 a.m. EDT.

Where: Connecticut State Data Center embargo site.

Interview requests: Embargo subscribers may interview Connecticut State Data Center staff during the embargo period.  To request an interview, email ctsdc@uconn.edu.

Obtain media and Connecticut focused data organizations embargo access: Visit the Connecticut State Data Center’s embargo website for access.

Embargoed summary documents, press release templates, data visualizations, and raw data may not be released to the public by any means (including print, broadcast, Internet, podcast, social media, blogs, or in any other form) prior to public release.  The public release will be at 12:01 a.m. EDT, Thursday August 31, 2017.

For more details on the embargo and how to request embargo access, visit the Connecticut State Data Center Embargo site.

Connecticut’s Population is Expected to Grow Slowly, Connecticut State Data Center Reports

For Immediate Release: Monday July 31, 2017
(Revised September 19, 2017)

Connecticut’s Population is Expected to Grow Slowly, Connecticut State Data  Center Reports


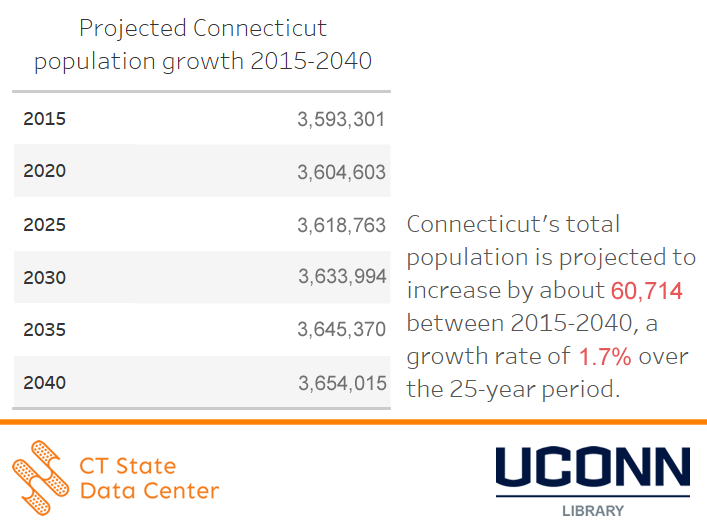
July 31, 2017 –  The state of Connecticut is expected to add about 60,700 residents from 2015 to 2040, according to the 2015 to 20140 population projections for the state of Connecticut, released today by the Connecticut State Data Center.


The new projections, based on the age characteristics of the states population along with recent birth, death, and migration rates, indicate that the states resident population is expected to grow from about 3.59 million in 2015 to approximately 3.65 million in 2040, a 1.7% growth rate over the 25-year period.
projected_Connecticut_population_growth_2015_2040_table

Figure 1: 2015 to 2040 Population Projections for the State of Connecticut

The slow projected growth mirrors that of states in the region, with most states in New England predicting small gains in population, or even negative growth, in the foreseeable future.


From 2010 to 2030, Connecticut is projected to gain 1.7%, Maine is projected to lose 0.5%, Massachusetts is projected to gain 10.4%, New Hampshire is projected to gain 6.6%, New York is projected to gain 2.2%, Rhode Island is projected to gain 1.7%, and Vermont is projected to gain 7.1% in population, according to projections produced by each of the respective states.

regional_population_changes_for_New_York_and_New-England_2010_2030

Figure 2: Projected Population Change for New York and New England, 2010 – 2030*


A main factor driving low projected growth are regional trends in fertility rates, the number of births per 1,000 women of childbearing age. New England states fertility rates trailed those of all other states in 2015, according to the latest data from U.S. Health and Human Services. Connecticut’s fertility rate of 52.5 was the 5th lowest in the country, slightly greater than rates in Rhode Island, Massachusetts, New Hampshire and Vermont, which ranked last.


As the baby boomer generation ages, a generational shift is projected to occur in Connecticut as the Millennials (individuals born 1981-2000) remain a nearly stable population in Connecticut while the population born after 2000 is projected to continue to rise from 637,000+ in 2015 to a projected 1.8 million by 2040.

projected_change_for_generations_born_after_1945_ct_projections_2015_2040

Figure 3: Projected Change for Generations Born after 1945


“Land of steady habits” summarizes the overall recent trends of birth, mortality, and migration rates, trends which are held constant in the projection models. Migration – both domestic and international – also contributes to changes in Connecticut’s projected population.  With recent years seeing Connecticut’s population change nearing a net zero, when compared to birth, mortality, and international migration, it is important to look at the entire picture of data to see that Connecticut continues to experience growth.

With a projected 1.7% growth rate projected from 2015 to 2040, this rate can be influenced by a number of factors ranging from changes in domestic and international policy related to migration, to changes in fertility rates.


Figure 3: Projected Change in Population for Generations Born After 1945

The population projections included in this release are based solely on demographic trends, and do not attempt to predict or account for future changes in economic, employment, or housing factors in the state.
For more details on the data release and how to view and access data, visit the Connecticut State Data Center 2015 to 2040 Population Projections site.

Note: This Press Release was updated on September 19, 2017 to correct an error in the data that was published on July 31, 2017.

Connecticut State Data Center Embargo Release of 2015-2040 Population Projections for the State of Connecticut

July 25, 2017 – The Connecticut State Data Center will release the 2017 edition of the state of Connecticut Population Projections for 2015 to 2040 on July, 31, 2017.  This release will include population projections by five year age cohorts and sex for the State of Connecticut.  This release only includes state population projection with other geographies for Connecticut to be released in upcoming releases.  Prior to the public release of the state population projections for 2015 to 2040, the Connecticut State Data Center will offer embargo access to the media and to Connecticut focused data organizations in advance of the public release.

When: Friday, July 28, 2017 at 10 a.m. EDT to Monday July 31, 2017 at 12:01 a.m. EDT.

Where: Connecticut State Data Center embargo site.

Interview requests: Embargo subscribers may interview Connecticut State Data Center staff during the embargo period.  To request an interview, email ctsdc@uconn.edu.

Obtain media and Connecticut focused data organizations embargo access: Visit the Connecticut State Data Center’s embargo website for access.

Embargoed summary documents, press release templates, data visualizations, and raw data may not be released to the public by any means (including print, broadcast, Internet, podcast, social media, blogs, or in any other form) prior to public release.  The public release will be at 12:01 a.m. EDT, Monday July 31, 2017.

For more details on the embargo and how to request embargo access, visit the Connecticut State Data Center Embargo site.

Housing Units Source of Heat in Connecticut

How does Connecticut heat up their homes during the cold seasons? There are numerous ways to provide heat for a home. This visualization shows the different types of heat sources and how many housing units use them for each Connecticut town. You can see trends in the data when looking at the maps. Towns with urban environments tend to use utility gas and kerosene as a source of heat. Rural and suburban towns tend to use liquefied petroleum gas or wood as heating sources. Surprising data I found is that some homes use solar energy for heat. There is not a lot of homes that use solar energy, but maybe the number will increase in the future as we adapt to more renewable energy. The data source is from the American Community Survey 5-year estimate from 2011 to 2015. This data visualization is for the 2015 year.


https://public.tableau.com/views/HeatingSourceMapsandFiguresFeb2/Story1?:embed=y&:display_count=yes

Poverty and Educational Attainment by Gender in Connecticut

The following visualization explores poverty levels in Connecticut by township; as well as by educational attainment. The data is provided by the US Census Bureau through the American Community Survey 2015 5-year estimates (2011-2015). My goal in assessing this data was to observe trends of poverty in Connecticut, as it relates to education level, location, and gender. Through the visualization it can be observed that the highest pockets of poverty are found in Bridgeport, Hartford, New Haven and Waterbury. These cities have the largest populations in the state which also correlates to the largest numbers of poverty. There was a large discrepancy in poverty rates, in the category of gender. Females had a greater instance of poverty at 60% compared to males at 40%. In the category of education, individuals whose highest level of education was a high school diploma were found to have the highest occurrence of poverty. Contrary to popular belief, people who have some college/associates degree were in many cases, just as likely to be living in poverty as people who earned less than a high school degree.

The most effective way to utilize this dashboard is to view it for statewide trends or town data. If you are looking for information on a particular town in Connecticut, select that town in the table on the right. By selecting the town, the other charts and map will be updated to reflect information only for this town. If you would like to look at multiple towns at once you can select more than one by holding the control key (Windows) or command key (Mac) and selecting the additional town(s). It is important to note that by comparing multiple towns, the statistics will be a sum of all towns included.

Data Source:
https://factfinder.census.gov/bkmk/table/1.0/en/ACS/15_5YR/B17003/0400000US09.06000

[xyz-ihs snippet=”Poverty-in-cT-by-ed-attainment”]

Changes in economic indicators in Connecticut towns

Last week’s release of the 2011-2015 American Community Survey 5-Year Estimates by the U.S. Census Bureau provides new demographic and socioeconomic data for all Connecticut towns, including estimates of  income, poverty, and workforce characteristics. One especially detailed table in this new dataset – made available by the American Community Survey since the program began – is DP03: Selected Economic Characteristics (see links appearing to the left of the table in American FactFinder to view data for previous years). Because the survey periods don’t overlap, the economic estimates published in the  2015 5-Year Estimates dataset can be compared with the 2010 5-Year Estimates data for evidence of change. The graphics below employ a calculation which determines whether town-level economic measures increased or decreased beyond the margin of error of the survey estimates, and illustrate these statistically significant changes between the 2006-10 and 2011-15 survey periods  for several economic indicators.

[xyz-ihs snippet=”2015-Economic-Change-in-CT-Towns”]

For help with locating U.S. Census Bureau data for Connecticut, including American Community Survey data, please contact the Connecticut State Data Center.

Educational Attainment in CT 2010-2015

This data looks at trends in the maximum level of education attained in Connecticut for residents over the age of 25 from 2010 to 2015. Across the state, the percentage of peoples who have achieved less than the equivalent of a high school education is much lower than those who have. Additionally, the percentage of people who have some college education but no degree or who hold an Associate’s degree is much lower than the percentage of those who hold a Bachelor’s degree. From 2010 to 2015 there is an increase in Graduate or Professional degrees earned and a subsequent decrease in the percentage of people who hold only Bachelor’s degrees. Urban areas such as Hartford, New Haven, and Bridgeport are more likely to have lower rates of degree attainment. Attainment of education beyond a high school diploma or its equivalent is less prevalent in the eastern part of the state while the southwestern part of the state has higher percentages of people who have obtained either their Bachelor’s or a Graduate degree. From 2010 to 2015, many towns saw increases in higher education attainment and decreases in the relative percentages of people who have not attained an education beyond the high school level.

[xyz-ihs snippet=”Ed-Attainment—Caroline-M”]