Month in Review – CtSDC & MAGIC – August 2012
 The Connecticut State Data Center (CtSDC) and the University of Connecticut Libraries Map and Geographic Information Center (MAGIC) continue to expand upon our web resources to include more data, gis datasets, interactive maps, historical maps, and aerial photography. During the month of August 2012, most web products experienced an increase in usage, when compared to the same time period one year prior, and the number of inquiries received continues to rise, including the amount of time devoted to each question. Included below are highlights from August 2012 which focuses on five main areas: User Inquiries, Web Content Views, Trends in Webpage Usage, Trends in Keywords, and Projects in Progress.
I. User Inquiries
Total User Inquiries
Included below are the statistics for user inquiries received by phone, email, and in-person during August 2012. As the data clearly visualizes, the number of inquiries continues to rise with the year to date totals representing a 120% increase when compared to the January 1- August 31 of the previous year.
|
|
Total Inquiries
|
Monthly Change
vs. 2011 |
YTD Inquiries
for 2012 |
YTD Change
vs. 2011 |
|
Connecticut State Data Center
|
153
|
99%
|
1,137
|
97%
|
|
MAGIC
|
143
|
240%
|
1,106
|
150%
|
|
|
||||
|
Total
|
296
|
149%
|
2,243
|
120%
|
II. Web Content Views
Total Unique Content Views
Included below are the web content unique views statistics for August 2012 which include comparisons with August 2011, the year to date (YTD) unique views and the change in the total number of unique views when compared to the same time period (January 1 – August 31) from the previous year.
|
Web Resource
|
Unique Views
|
Monthly Change
vs. 2011 |
YTD Unique Views
for 2012 |
YTD Change
vs. 2011 |
|
Connecticut State Data Center
|
1,480
|
22%
|
12,228
|
13%
|
|
MAGIC 2.0 Online Maps
|
386
|
-34%
|
4,063
|
-48%
|
|
MAGIC Flickr Collections
|
30,075
|
50%
|
274,210
|
55%
|
|
MAGIC News Blog (Retired)
|
48
|
167%
|
293
|
23%
|
|
MAGIC Website
|
13,490
|
39%
|
99,536
|
14%
|
|
Outside the Neatline Blog
|
823
|
-48%
|
6,941
|
19%
|
|
|
||||
|
Total*
|
46,302
|
40%
|
397,285
|
37%
|
* Total includes CT View
Total Content Views
With more users viewing web content more than once from MAGIC and the Connecticut State Data Center, the total views of web content provides a more detailed view of the trends in usage. The following table includes the usage trends for the total number of views, monthly change when compared to same month in 2011, the year to date (YTD) total number of views and the change in total views when compared to the same time period (January 1 – August 31) from the previous year.
|
Web Resource
|
Total Views
|
Monthly Change
vs. 2011 |
YTD Total Views
for 2012 |
YTD Change
vs. 2011 |
|
Connecticut State Data Center
|
2,058
|
15%
|
17,963
|
10%
|
|
MAGIC 2.0 Online Maps
|
2,986
|
-36%
|
34,370
|
-55%
|
|
MAGIC Flickr Collections
|
30,075
|
50%
|
274,210
|
55%
|
|
MAGIC News Blog (Retired)
|
67
|
191%
|
417
|
48%
|
|
MAGIC Website
|
20,562
|
34%
|
156,252
|
15%
|
|
Outside the Neatline Blog
|
1,136
|
-44%
|
9,455
|
20%
|
|
|
||||
|
Total*
|
56,884
|
30%
|
492,681
|
19%
|
* Total includes CT View
III. Trends in Webpage Usage – August 2012
Ever wondered what the most popular pages are at MAGIC and the Connecticut State Data Center? Included below are the top 5 most popular pages for August 2012.
Most Popular pages – Connecticut State Data Center
|
Page
|
Total Views
|
|
518
|
|
|
512
|
|
|
263
|
|
|
197
|
|
|
133
|
Most Popular pages – MAGIC
|
Page
|
Total Views
|
|
5,210
|
|
|
3,218
|
|
|
1,300
|
|
|
1,081
|
|
|
1,026
|
Most Popular pages – Outside the Neatline Blog
|
Page
|
Total Views
|
|
99
|
|
|
91
|
|
|
83
|
|
|
78
|
|
|
58
|
IV. Trends in Keywords – August 2012
At the Connecticut State Data Center and MAGIC each month we analyze keyword searches conducted on our websites to determine areas to focus increasing accessing to maps, data, and resources. Keyword provide us with an opportunity to see trends, areas for improvement, and have been integral to providing guidance on website development and improvements. Included below are keyword trends for August 2012.
Most Frequent Keywords – Connecticut State Data Center
|
Keyword
|
|
No Trends this Month
|
Most Frequent Keywords – MAGIC
|
Keyword
|
|
Scotland
|
|
campus map
|
|
Arkansas
|
|
England
|
|
Florida
|
V. Projects in Progress – August 2012
Each month the students and staff at MAGIC and the Connecticut State Data Center are working on a series of projects, tasks, data sets, and resources which users typically don’t know about until we add the resource to our website. Included below is a list of projects that are currently underway which will be completed in the coming months and made available in their final forms via our websites.
- Connecticut Population Projections 2015-2025 – Additional refinements are being made to the population projections methodology to prepare for the finalized version of the population projections for Connecticut at the state, county, regional planning organization, and town levels. This past month considerable effort has been spent on scripting the development of the town level population projections, which will enable future revisions to the projections to be provided in an expedited time frame. This project is still underway and the public is able to view a preliminary version (population estimates are subject to change as we refine the methods over the next month). View the preliminary projections and the interactive data interface at: http://ctsdc.uconn.edu/projections.html
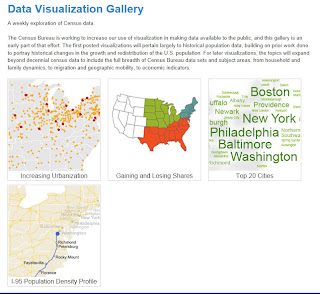
- Data Visualization – After testing multiple data visualization software packages and APIs, Tableau Public has been selected for additional testing as it enables an interactive interface with sliders, charts, graphs, tables, and maps. This past month a successful test of adding census tract boundaries to Tableau for Connecticut showcased the full potential of this tool as additional geographies can be added which are not included as a default within the software.
- Google Floor Maps – Preparations began for editing floorplans for the Homer Babbidge Library which will be uploaded to the Google Floor Maps project. In coming months these maps will be available within Google Maps for Android users and will provide detailed information to help navigate each floor to locate materials, services, and other important locations. Learn more about this in the following article from Wired.
Have an idea for a project or suggestions for improvements to MAGIC and the Connecticut State Data Center’s website and web offerings? Leave us a comment or contact us at magic@uconn.edu.
Each month we will be posting a “Month in Review” article so check back next month to see the latest information on usage trends at MAGIC and the Connecticut State Data Center.