New Version of U.S. Census Bureau’s OnTheMap for Emergency Management Web Application

New Version of OnTheMap for Emergency Management Web Application

New features in the U.S. Census Bureau’s OnTheMap application improve access to workforce and demographic statistics for emergency preparedness, response and recovery activities. The application automatically incorporates real-time data updates from the National Weather Service’s National Hurricane Center, Department of Interior, Department of Agriculture, and the Federal Emergency Management Agency (FEMA).

New features include:

  • New emergency event data: Addition of FEMA disaster declaration areas and National Weather Service snowfall probability forecasts
  • More complete hurricane archives: Capture and archiving of all daily National Hurricane Center storm updates
  • Expanded report content: Addition of 2010 Census demographic and housing characteristics, and 2010 jobs and worker statistics
  • New analyses and visualizations: New reports with charting and thematic map overlays showing population and worker origin and destination distributions
  • New interoperability: New tool for exporting event areas to use in OnTheMap or other GIS applications
  • Updated interface and help documentation: Improved user interface speed and navigability, improved event searching, newly updated help documentation
View this new version of the OnTheMap for Emergency Management Web Application at: http://onthemap.ces.census.gov/em.html

A Half Century of Special District Growth Webinar


Webinar:
A Half Century of Special District Growth
Special district governments make up a significant portion of local government yet tend to be the most misunderstood type of government.  In the past 50 years, special districts have outpaced their county and municipal counterparts in growth in both number and significance.  This presentation will use Census data to explore the evolution of this type of government over time, attempt to explain how these governments are structured, how they operate, where they exist, what purposes they serve, and what the future might hold.

Date: July 24, 2012

Time: 2:00 PM – 3:00 PM Eastern 


PresenterSteve Owens, U.S. Census Bureau

Registration: 
 

Treworgy Planetarium Summer Evening Series

A3P Spitz Star Projector

The Treworgy Planetarium of Mystic Seaport is pleased to announce its five part summer series for 2012.  Programs will begin with updates on current events in the evening sky followed by an extended presentation of the topic for that evening.  Afterward, if weather permits, the indoor program will be followed by an outdoor observation session using the planetarium telescopes.  This is a great opportunity to explore geography from a different perspective (not to mention scale!)  Of particular interest to geographers are the July 20th and August 3rd lectures.
Schedule: All Programs begin at 8:30 PM (entrance at the administrative gate)
June 22, 2012       The Summer Evening Sky
July 6, 2012          The Zodiac
July 20, 2012        The Milankovitch Cycle and the Earth’s Climate
August 3, 2012     The Moon and Tides
August 17, 2012   Extrasolar Planets 

View Administrative Entrance in a larger map

Costs:
Visitors $7.50 per person
Members $6.00 per person
Children (15 and under): $3.00
Event Details can be found on our Facebook and Events Page
Follow Us on Twitter: @MS_Planetarium
Follow Us on Facebook: /MS_Planetarium

Contact Jeff Dunn at jeff.dunn@mysticseaport.org for more details.

“Free and clear” mortgage status data from the American Community Survey and 2010 Census

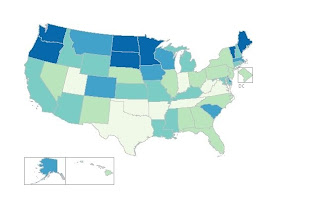
 Despite the expansion of mortgage debt in the last decade, according to the latest American Community Survey data one third of owner-occupied households (i.e. those owning – not renting or leasing – their house, condo, apartment, etc.) own their homes “free and clear” of any mortgage or home equity loan. In gathering this data, the Census Bureau’s American Community Survey questionnaire asks whether owner-occupied properties have a “mortgage, deed of trust, or similar debt,” and in the absence of any primary mortgage, whether there is a second mortgage or home equity loan (questions 19 and 20). Nationally, more than 24 million homes – 32.8% of owner-occupied housing units – have no primary or secondary mortgages. The prevalence of free and clear mortgage status for owner-occupied housing units varies regionally from 23.5% in Maryland, to 50.3% in West Virginia:

<a href=”undefined”><img alt=”Dashboard 1 ” src=”http://public.tableausoftware.com/static/images/Mo/MortgageStatusAgeandIncome/Dashboard1/1_rss.png” style=”border: none” /></a>

 Connecticut lags slightly behind the national average in the percentage of owner-occupied housing units owned free and clear in the state; according to American Community Survey 2010 data, 28.5% of owner-occupied homes in Connecticut have no mortgage debt. Of these households, trends in the age of the householders, and median household income, were consistent with national trends. About 60% of the householders (the individual completing the ACS questionnaire) in mortgage-free households were 65 or older; 39% were aged 35-64, and only 1.4% were under 35. In Connecticut, as in all states, median household income in owner-occupied homes is significantly less than in households where the home is mortgaged. Median household income in Connecticut among households carrying a mortgage was $94,298, while median income in mortgage-free households was $52,435.

 Homeownership and mortgage status data were also gathered by the 2010 Census. Question 3 of the 2010 Census questionnaire asked if the housing unit was either “owned by you or someone in this household with a mortgage or loan? Include home equity loans”, or “owned by you or someone in this household free and clear (without a mortgage or loan)”. For mortgage status information at the town level, the Census 2010 data provides more current data than the ACS 5-year Estimates. According to 2010 Census figures, 26.4% of owner-occupied homes in Connecticut were owned free and clear (slightly less than the figures published for the 2010 ACS 2010 1-year estimate). Free and clear status among owner-occupied homes among Connecticut towns ranged from 16.2% in Sterling, to 41.2% in Cornwall.

<a href=”undefined”><img alt=”Dashboard 1 ” src=”http://public.tableausoftware.com/static/images/of/ofCThomesownedfreeandclear/Dashboard1/1_rss.png” style=”border: none” /></a>

For detailed data from the American Community Survey in American FactFinder, see:

For additional data on mortgage status from the 2010 Census in American FactFinder, see:

On The Map for Emergency Management Webinar – June 20, 2012

Webinar:
OnTheMap for Emergency Management
June 20, 2012
1:30 PM – 2:30 PM Eastern

Discover OnTheMap for Emergency Management Version 3 new features that improves access to and utility of Census workforce and demographic data for emergency preparedness, response, and recovery activities including incorporating Federal Disaster Areas, Snowfall Forecasts, and 2010 Census demographic and housing characteristics.
Presenter:
Robert Pitts, U.S. Census Bureau
 
For registration questions, please contact Lauren Gilchrist.  For content-related questions, please contact Earlene Dowell.

TIGERweb Map Viewer and WMS from US Census Bureau

The U.S. Census Bureau has released a new version of TIGERweb, a Web-based map viewer from the agency’s Topologically Integrated Geographic Encoding and Referencing System (TIGER) database. TIGERweb allows users to view and query census geographic areas and features such as roads, railroads, rivers, lakes and other larger bodies of water. It currently displays boundaries, names and codes for 2010 Census legal and statistical geographic areas, such as counties, cities, towns and townships, census tracts and urban areas. In addition, TIGERweb contains population and housing unit counts from the 2010 Census for each of the geographic areas.

To access TIGERweb, go to: http://tigerweb.geo.census.gov

WMS Service now available!

In addition to the TIGERweb viewer, the TIGER data also is available as a Web service via the Open Geospatial Consortium Web Map Service standard. Users who have a client that supports the Web Map Service (such as ArcGIS) may access the TIGERweb service at
http://tigerweb.geo.census.gov/ArcGIS/services/tigerWMS/MapServer/WMSServer

Explore TIGERweb by watching this brief video

2011 Characteristics of New Housing Report

2011 Characteristics of New Housing

This report provides annual statistics on the characteristics of new privately owned residential structures for the U.S. and the nation’s four regions — Northeast, South, Midwest and West. The statistics are gathered from the Census Bureau’s Survey of Construction, and the report includes characteristics such as type of wall material, number of bedrooms and bathrooms, type of financing, heating and square footage.


A Few Highlights from the 2011 Report:

  • The average single-family house completed was 2,480 square feet. In 2010, the average single-family house was 2,392 square feet.
  • 33% of the new single-family homes sold in the U.S. had vinyl siding as the principal type of exterior wall material. For attached single-family homes sold, it was 41% and for detached single-family homes sold, it was 32%.
  • 88% of all single-family homes completed had air-conditioning. By region, the proportions were 81% in the Northeast, 91% in the Midwest, 99% in the South, and 62% in the West.
  • 39% of single-family homes completed had 4 or more bedrooms. 48% of them had 3 bedrooms.
  • Of the single-family homes completed with 4 or more bedrooms, 57% had 3 or more bathrooms.
  • 19% of new single-family homes sold had a garage that could hold 3 or more cars.
To explore additional data related to new housing characteristics for 2011, view this report at: http://www.census.gov/construction/chars/

Voting Report: State-Level Maps and Graphs on Voting

Voting Report: State-Level Maps and Graphs on Voting
Check out the Voting Patterns by State
 
The Census Bureau has released a menu-driven, interactive Web page permitting users to access for any state a series of graphs showing percentages of adults who voted and registered in every congressional and presidential election between 1996 and 2010. In addition to graphs showing voting and registration trends over the period, users may choose a given election year and find separate graphs showing voting and registration by one of the following characteristics: age, sex, educational attainment, and race and Hispanic origin. Some analysis of the 2010 election is provided as well, as are thematic maps of states showing percent voting during each election. The statistics come from the Current Population Survey. 
 
View additional information at the US Census Bureau Voting Registration Voting Hot Report

Mark Your Calendars – GIS Planning, Preparation, and Mitigation for Natural Disasters Meeting – June 29, 2012

Connecticut GIS User to User Network Quarterly Meeting – GIS Planning, Preparation, and Mitigration for Natual Disasters

The Connecticut GIS User to User Network Quarterly Meeting will be held on Friday June 29, 2012 and will focus on GIS Planning, Preparation, and Mitigation for Natural Disasters. This meeting is free and open to the public!

Date: Friday June 29, 2012
Time: 8:30am (Networking) with Presentations from 9:00am-12:00pm
Location: South Central Connecticut Water Authority – 90 Sargent Drive New Haven, CT
For additional information visit the Connecticut GIS User to User Network website at: http://ctgis.uconn.edu 

Pizza, (Root)Beer, and GIS Workshop – June 21, 2012

Connecticut GIS User to User Network – Pizza, (Root)Beer, and GIS!

Are you interested in learning more about GIS? The Connecticut GIS User to User Network is offering a free workshop to explore GIS which will include a series of presentations and break-out hands-on workshops. So if you have been wonder what GIS is and how you might use this technology be sure to register for this free event!

Date: Thursday June 21, 2012
Time: 6:00pm – 9:00pm
Location: Central Connecticut State University – New Britain, CT
Cost: Free!
Food: Food will be provided thanks to our sponsors!
Details:
The Connecticut GIS User to User Network is sponsoring a free evening education seminar on an introduction to GIS at Central Connecticut State University in New Britain, Thursday, June 21, 2012 starting at 6:00 PM till 9:00 PM. It will begin with informational presentations by expert GIS professionals to provide you with foundational basics to introduce you to the technology and principles of GIS. It will be followed by break out sessions for hands on instruction to allow you to experience using GIS with specialists to teach you a simple application that you can take with you. The breakout sessions will be focused on K-12 Educators, Planning Professionals, and First Responders (fire, police, and rescue). This event will be free of cost and dinner will be provided. Space is limited to 20 members from each group and registration is required. See here to register:

More specific location details will be sent to registrants prior to June 21.

For additional information visit the Connecticut GIS User to User Network website at: http://ctgis.uconn.edu