Updated Connecticut Population Projections Now Available through CtSDC

About the Projections

The Connecticut State Data Center at the University of Connecticut Libraries Map and Geographic Information Center (MAGIC) has just released updated population projections for Connecticut based on the 2010 Census data. The population projections include state, county, regional planning organization, and town level population projections for 2015, 2020, and 2025 and include population totals, age groups, and age groups by sex projections. The projections were developed through a collaboration between the Connecticut State Data Center, the Office of Policy and Management, the Connecticut Department of Public Health, and the Department of Geography at the University of Connecticut. 
Population projections are essential for planning, analysis, and informed decision making and these updated projections provide users with three scenarios for population change for 2015, 2020, and 2025 to highlight potential changes in the population based on increases/decreases in the fertility rates within a geographic location. The Connecticut State Data Center has included three fertility rates (high, medium, and low) for each year to provide users with a range of potential population changes and these three rates highlight that population projections are estimates which are subject to change based on a number of factors. Included below are brief definitions of each fertility rate included in these projections.
High Fertility Rate: This scenario assumes a high rate of population growth which based on recent trends in Connecticut’s population is least likely to occur. The High Fertility rate scenario serves as a guide of what could happen if the selected geography experienced a baby boom type scenario
Medium Fertility Rate: This scenario assumes a medium rate of population growth.This scenario would be most likely for areas experiencing moderate growth.
Low Fertility Rate: This scenario assumes a low rate of population growth. This scenario would be most likely for areas with slow population growth.


Exploring the 2015-2025 CtSDC Population Projections

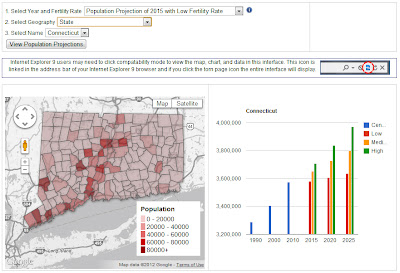
The 2015-2025 Population Projections are available via the interactive data viewer developed by the Connecticut State Data Center. This viewer allows users to select a year and fertility rate, select the geography (State, County, Regional Planning Organization, and Town), and select the place you want to view projections data. The Viewer includes an interactive map, an interactive chart, and an interactive table of data which is sortable. In the coming weeks, users will be able to download this data in spreadsheet and shapefile formats.

View the 2015-2025 Population Projections for Connecticut at: http://ctsdc.uconn.edu/projections.html

Using GIS to Evaluate Vulnerability to Climate Change: A Case Study of Martha’s Vineyard

Dukes County, Massachusetts is composed of the county subdivisions on the island of Martha’s Vineyard and the Elizabeth Islands, which form the town of Gosnold. A few weeks ago, I completed my M.A. thesis in the Geography department which investigates where climate change could impact Dukes County. My study evaluates vulnerability to climate change through the examination of social vulnerability and vulnerability to climate sensitive hazards (i.e. sea level rise and storm surge events) and is designed to coincide with the jurisdiction of the Martha’s Vineyard Commission. The thesis includes maps created in ArcMap, with data from MassGIS, that locate vulnerable areas in the county as well as quantify the potential impact of hazards on specific land use categories. Additionally, a social vulnerability index quantifies vulnerability based upon demographic data from the 2010 Census and 2010 American Community Survey.

The overarching goal for this project was to develop a theoretical framework that serves as a GIS-based decision support system for policy makers to determine where climate change adaptation policies are needed. This framework is operationalized through a case study of vulnerability of Dukes County, Massachusetts. The abstract of the study can be seen below:

Climate Action Plans (CAP’s) are recent innovations in policy that have been catalyzed by a need to adjust the relationship between human activity and the Earth’s climate system. CAP’s often are composed of methods to mitigate greenhouse gas emissions in addition to adaptation strategies. Research indicates, however, that many plans focus on mitigation strategies while adaptation policies related to predicted changes caused by climate change are often overlooked. This thesis presents an integrative framework for locating areas that are in need of adaptation strategies through a GIS based decision support system that visualizes vulnerability. It is operationalized through an empirical study of Dukes County, Massachusetts.


Dukes County is a New England county composed of the islands of Martha’s Vineyard and Gosnold. The county has a long history of commercial fishing, but more recently caters to affluent seasonal tourists. With both economic activities heavily reliant upon the ocean as a resource, climate sensitive hazards, such as sea level rise and tropical storms, pose an important risk to the population, built environment, and the natural environment that has made the study area a highly desirable New England tourist destination.

The results of my case study conclude that long term climate processes have shaped the way in which Dukes County has developed through the geomorphic influence of the last glaciation. The up-island towns of Martha’s Vineyard (Aquinnah, Chilmark, & West Tisbury) and Gosnold differ in geography- both physically and socially- from their down-island counterparts (Edgartown, Oak Bluffs, & Tisbury). This geographic variation results in an unequal distribution of vulnerability related to climate sensitive hazards distributed throughout the county, which have been identified as storm surge events in addition to chronic sea level rise. Generally speaking, my study concludes that…

Flatter land that is also lower in elevation down-island has traditionally been developed and inhabited more than the up-island land of Martha’s Vineyard and the islands of Gosnold. Consequently, larger populations and more developed land are at risk to hazards whose exposure is largely dependent upon elevation, like storm surge and sea level rise (down-island). 

The full text of this study is now available online through Digital Commons@UConn: An Integrated Approach for Developing Adaptation Strategies in Climate Planning: A Case Study of Vulnerability in Dukes County, Massachusetts

Historical Aeronautical Navigation Maps at MAGIC

Today in the United States we can fly coast to coast in a commercial airliner comfortably in less than 6 hours. Air travel has not always been this easy or seamless. Historical air navigation techniques and practices can help us envision the beginnings of air travel and air mail, and really show how drastically aviation navigation technology has evolved in just over 100 years of flight. To help relive and appreciate air navigation from the onset of commercial flight, the University of Connecticut Libraries Map and Geographic Information Center (MAGIC) brings you an interactive index to help users identify flight routes commonly used for passenger and air mail service in the 1920’s and 30’s. Back then there was no such thing as hitting the direct button on your Garmin and following the pink line to your destination!
The creation of this historical aeronautical navigation chart index provides pilots and aviation enthusiasts with a glimpse into how far air navigation methods and technology have progressed since the inception of powered flight. The University of Connecticut Map and Geographic Information Center (MAGIC) includes an extensive collection of navigation charts spanning in time from 1923 through 1935. There are more than 150 charts in the collection that span across the contiguous United States. Pilots at the time used the charts for navigation purposes including airmail delivery and the first commercial passenger service provided by the Ford Tri-Motor aircraft. Ford Motor Company produced an artistic route overview map in 1928 that is contained in the collection.
When the collection was digitized by the University of Connecticut Libraries in spring of 2011, Trevor was in the process of trying to procure an internship as part of my undergraduate major in Geography for fall 2012. When Trevor mentioned his interests and background to the staff at MAGIC, immediately a project was identified to georeference and create an interactive index for the collection of historical air navigation maps from MAGIC’s collections. The project focused on developing an interface for fellow pilots and enthusiasts to access and appreciate these relics of aeronautical navigation technology that bear many striking resemblances to aeronautical sectional navigation charts of present day. In preparation for this project, the historical navigation charts would be digitized using a high-resolution camera in multiple sections over the summer of 2011 to be later digitally reassembled. For more information on the digitization equipment utilized by the University of Connecticut Libraries visit: http://digitalcollections.uconn.edu/equipment/equipment.html.  
In the fall, Trevor began the process of creating mosaics of two images captured for each chart. After a mosaic was created and the complete charts were saved in raw uncompressed TIFF format, they were ready to be georeferenced. Georeferencing the image provides a way for each map to be overlaid within GIS software applications, Google Earth, Google maps and other applications in a spatially meaningful way. Trevor Utilized Adobe Photoshop to convert the JPF files from the digitized original photographs to TIFF images, and then created mosaics of the full charts. It was a slow and tedious process and had to be done with great care so that the georeferencing would go smoothly and with minimal error. It took an entire semester and a few weeks of another semester to complete the mosaicing and georeferencing of each image. Once this was completed the files were digitally archived.
To make these maps accessible to the public, an index was created to enable users to easily locate and identify maps for specific routes. To create this index, ESRI’s ArcGIS ArcMap 10 software was used to create a shapefile based on the geographic extent of each map. Then this shapefile was converted to a Keyhole Markup Language (KML) file for viewing with Google Earth and Google Maps. The KML file was then uploaded to Google Fusion Tables and joined to a spreadsheet that included links to each air navigation map. To ensure the index interface was easy to use, the Google Fusion Tables map interface was customized using the Google Fusion Tables API to develop custom dropdown menus and to refine the appearance of the map. This index will enables users to locate and download full-quality georeferenced images of each map and will be the first time that these historic air navigation charts will be easily identified and made available for public viewing and use. 
Interface for viewing air navigation maps in the MAGIC collection

NEURISA Day 2012 Call for Presentations – Now Open

The New England Chapter of Urban & Regional Information Systems Association (NEURISA) will host its annual conference on Monday, October 15th at Old Sturbridge Village, Sturbridge, Massachusetts.  This one day conference will include keynote sessions, vendor demonstrations, and presentations from your colleagues in the geospatial and information technology community. 
NEURISA invites you to submit an abstract proposal for a 20-minute presentation in the following categories:
  • Mobile & Web Technology
  • What’s New in GIS / Spatial?
  • IT Trends (e.g. virtualization, cloud technology, open source)
  • LiDAR
Abstract submission requirements:
  • Abstracts should be less than 300 words.
  • Abstract must be submitted by July 2nd, 2012.
  • Presentations cannot be product marketing.
  • Please submit your presentations online at: www.neurisa.org/neurisaday2012abstract
Questions?  please contact Mike Olkin, olkinm@amherstma.govor Steve Sharp, steves@vcgi.org
NEURISA Corporate Sponsors: AppGeoCartegraphCDM SmithCritigenDGT Survey Group New England GeoSystems SewallTighe & BondVHB

The New England Chapter of the Urban & Regional Information Systems Association (NEURISA) is a professional organization that provides a forum for: promoting and facilitating the use and integration of spatial information technology, fostering relationships, professional development, and representing the interests of Geographic Information System (GIS) practitioners and Information Technology professionals across the New England region.


URISAis an international association for professionals using GIS and other information technologies to solve challenges in state/provincial, regional and local governments. 

Sharing Spatial Data in New England: Policies, Technology, and Trends Webinar

Interested in learning more about policy, technology, and trends in sharing spatial data in New England? NEURISA is offering a free webinar on Tuesday June 5, 2012 from 10:00am-11:30am which will feature 3 presentations on sharing spatial data. Included below is the agenda for this webinar.

Agenda:
Introduction and Overview of Town of Amherst GIS Data Sharing Program – Michael Olkin, Town of Amherst GIS Administrator and NEURISA President

From Public Records to Open Government: Access to Massachusetts Municipal Geographic Data Robert Goodspeed, MIT Department of Urban Studies and Planning.

2011 Storm Season Opens Doors to Data Sharing with Utility Companies Meghan McGaffin, GIS Analyst City of Milford, CT; Editor, CT GeoFocus; Municipal Representative, CT GIS User to User Network.

When: Tuesday June 5, 2012

Time: 10:00am-11:30am

Cost: FREE!

Registration: To register visit: https://www4.gotomeeting.com/register/773331303

A Future Without Key Social and Economic Statistics for the Country?

This past week, the U.S. House of Representatives passed a bill that contains the Census Bureau’s budget. This bill includes several cuts which would impact several datasets including the Economic Census and the American Community Survey (ACS), datasets which provides key economic, population, and housing data critical for planning, analysis and decision making by state and federal agencies, non-profit organizations, private industry, businesses, and researchers.

With the 2010 Census not including a long form, the American Community Survey is THE source for detailed income, poverty, and population data. If the American Community Survey is no longer available, critical datasets for planning, analysis and decision making will no longer available, leaving a great void in data needed for informed decision making in the private and public sectors.

Please take a few moments to review the following link includes a blog post from Dr. Robert Groves, U.S. Census Director, to learn more about how this bill could drastically alter data collection in this country. http://directorsblog.blogs.census.gov/2012/05/11/a-future-without-key-social-and-economic-statistics-for-the-country/

Included below is a brief video from Dr. Robert Groves about the impact this bill could have on data collected by the U.S. Census Bureau.

Connecticut State Data Center Annual Affiliates Meeting – May 11, 2012

The Connecticut State Data Center Annual Affiliates Meeting will be held on May 11, 2012 at the University of Connecticut Storrs Campus and will be include a live stream to enable virtual participation. The meeting will include presenters from state agencies, colleges/universities, organizations, businesses, centers, and more and will provide an opportunity to learn more about data within Connecticut and will encourage collaboration.

This meeting will feature a presentation from Ana Maria Garcia from the U.S. Census Bureau on the American Community Survey and the afternoon will feature a series of hands-on workshops related to data usage and mapping.

This meeting is open to the public and please share this announcement with anyone that would be interested in attending.

Details for the Connecticut State Data Center Annual Affiliates Meeting are included below

Date: Friday May 11, 2012

Time: 10:00am-4:00pm

Location: University of Connecticut Thomas J. Dodd Research Center – Storrs Campus

Cost: Free!

Who should attend?: Anyone is welcome to attend this meeting


Registration: Click Here to Register for In-person or for the Live Webcast  

Parking: Parking is available in the South Parking Garage

For more details on this event visit: http://ctsdc.uconn.edu/affiliates/

NEARC Spring Meeting – May 22, 2012

The Northeast Arc Users Group Spring Meeting will be held on Tuesday May 22, 2012 from 8:00am-5:00pm at Smith College in Northampton, MA. This meeting will feature multiple presentations on GIS, Spatial Analysis, Data Sharing, Census Data, and more and includes lunch for all participants!


Register soon to for the early bird discount. To register visit: http://www.cvent.com/d/lcqpjb/4W


For additional details on the schedule for the NEARC spring Meeting visit: http://www3.amherst.edu/~aanderson/nearc/schedule2012.html 


This is a great meeting and if you are interested in learning more about GIS and geospatial technology plan to attend! This meeting is a great networking opportunity and we hope to see you there!

2011 Annual Survey of State Government Tax Collections – Now Available

The 2011 Annual Survey of State Government has been released by the U.S. Census Bureau which indicates that overall tax collections for states increased $55.7 billion to $757.2 billion in fiscal year 2011, up 9.8%. General sales tax revenue was at $234.5 billion in fiscal year 2011, up 5.4%.

State Government Tax Collections 2011: Connecticut

Within the state of Connecticut, the 2011 Annual Survey of State Government indicates that State Government Tax Collections for Fiscal Year 2011 totaled $13,432,252,000. The following table includes a brief breakdown of the State Government Tax Collections for fiscal year 2011 for Connecticut:

State Government Tax Collections: 2011
(Amounts in thousands)
Item
Connecticut
    Total taxes
13,432,252
Property taxes
X
Sales and gross receipts
5,522,780
   General sales and gross receipts
3,252,123
   Selective sales taxes
2,270,657
      Alcoholic beverages
48,923
      Amusements
409,188
      Insurance premiums
195,968
      Motor fuels
477,772
      Pari-mutuels
7,220
      Public utilities
274,640
      Tobacco products
400,562
      Other selective sales
456,384
Licenses
446,755
   Alcoholic beverages
12,441
   Amusements
128
   Corporation
27,810
   Hunting and fishing
5,565
   Motor vehicle
195,286
   Motor vehicle operators
38,664
   Public utility
704
   Occupation and business, NEC
161,062
   Other licenses
5,095
Income taxes
7,142,062
   Individual income
6,469,246
   Corporation net income
672,816
Other taxes
320,655
   Death and gift
227,237
   Documentary and stock transfer
93,358
   Severance
60
   Other
0

To view (and download) this data and related information on the 2011 Annual Survey of State Government Tax Collections survey visit: http://www.census.gov/statetax